
📊 Data Analytics Portfolio Project: Business Performance Dashboards (2023)

🎯 Project Summary
As part of my data analytics portfolio, I developed two interactive Tableau dashboards—Sales Dashboard and Customer Dashboard—to uncover business insights for the year 2023. These dashboards present a comparative performance analysis between the current year (CY) and previous year (PY) using custom-calculated KPIs. Below is a detailed walkthrough of each dashboard and the analytical insights they deliver.
🔥 GitHub Repository1. Sales & Customer Intelligence: Dynamic Year-Over-Year Performance Insights
/* Year Filtering */
Current Year = [Select Year]
Previous Year = [Select Year] - 1

/* Core Aggregations */
{SUM([CY Sales])} = {SUM([CY Sales])}

/* Percentage Difference Metrics */
% Diff Customers = (COUNTD([CY Customers]) - COUNTD([PY Customers])) / COUNTD([PY Customers])
% Diff Orders = (COUNTD([CY Orders]) - COUNTD([PY Orders])) / COUNTD([PY Orders])
% Diff Profit = (SUM([CY Profit]) - SUM([PY Profit])) / SUM([CY Profit])
% Diff Quantity = (SUM([CY Quantity]) - SUM([PY Quantity])) / SUM([PY Quantity])
% Diff Sales = (SUM([CY Sales]) - SUM([PY Sales])) / SUM([PY Sales])
% Diff Sales per Customers =
  ([CY Sales per Customer] - [PY Sales per Customer]) / [PY Sales per Customer]

/* Derived Metrics */
CY Sales per Customer = SUM([CY Sales]) / COUNTD([CY Customers])
PY Sales per Customer = SUM([PY Sales]) / COUNTD([PY Customers])

/* Visual KPIs & Indicators */
KPI CY Less PY =
  IF SUM([CY Sales]) < SUM([PY Sales]) THEN '⬤' ELSE '' END

KPI Profit Avg =
  IF SUM([CY Profit]) > WINDOW_AVG(SUM([CY Profit])) THEN 'Above' ELSE 'Below' END

KPI Sales Avg =
  IF SUM([CY Sales]) > WINDOW_AVG(SUM([CY Sales])) THEN 'Above' ELSE 'Below' END

/* Monthly Extremes - Min/Max Highlighting */
Min/Max Customers =
  IF COUNTD([CY Customers]) = WINDOW_MAX(COUNTD([CY Customers]))
    THEN COUNTD([CY Customers])
  ELSEIF COUNTD([CY Customers]) = WINDOW_MIN(COUNTD([CY Customers]))
    THEN COUNTD([CY Customers])
  END

Min/Max Orders =
  IF COUNTD([CY Orders]) = WINDOW_MAX(COUNTD([CY Orders]))
    THEN COUNTD([CY Orders])
  ELSEIF COUNTD([CY Orders]) = WINDOW_MIN(COUNTD([CY Orders]))
    THEN COUNTD([CY Orders])
  END

Min/Max Profit =
  IF SUM([CY Profit]) = WINDOW_MAX(SUM([CY Profit]))
    THEN SUM([CY Profit])
  ELSEIF SUM([CY Profit]) = WINDOW_MIN(SUM([CY Profit]))
    THEN SUM([CY Profit])
  END

Min/Max Quantity =
  IF SUM([CY Quantity]) = WINDOW_MAX(SUM([CY Quantity]))
    THEN SUM([CY Quantity])
  ELSEIF SUM([CY Quantity]) = WINDOW_MIN(SUM([CY Quantity]))
    THEN SUM([CY Quantity])
  END

Min/Max Sales =
  IF SUM([CY Sales]) = WINDOW_MAX(SUM([CY Sales]))
    THEN SUM([CY Sales])
  ELSEIF SUM([CY Sales]) = WINDOW_MIN(SUM([CY Sales]))
    THEN SUM([CY Sales])
  END

Min/Max Sales Per Customers =
  IF [CY Sales per Customer] = WINDOW_MAX([CY Sales per Customer])
    THEN [CY Sales per Customer]
  ELSEIF [CY Sales per Customer] = WINDOW_MIN([CY Sales per Customer])
    THEN [CY Sales per Customer]
  END
📌 What These Metrics Reveal
- Year Filtering: Enables year-over-year comparison by defining the current and previous year dynamically via user input.
- Difference Metrics: Provide instant visibility into business momentum by comparing CY vs. PY for sales, orders, profit, customers, and quantity.
- Sales Efficiency:
CY Sales per Customerand its YoY % change offer a snapshot of customer value and purchasing power. - KPI Flags: Visual indicators like
KPI CY Less PYhighlight underperforming periods, whileKPI Profit AvgandKPI Sales Avgbenchmark performance against the average. - Min/Max Highlights: Monthly extremes visually anchor dashboards to show best/worst performance in key metrics, supporting pattern recognition and seasonality tracking.
🔍 Business Use Cases
- 🧾 Executive Summary KPIs: These metrics drive summary cards and trend graphs for sales, profit, and customer growth across time.
-
📉 Performance Monitoring: Track which months underperform via
KPI CY Less PYand understand whether they align with broader business cycles or anomalies. -
💡 Customer Insights: With
% Diff CustomersandSales per Customer, stakeholders can assess customer acquisition and monetization efficiency. - 🚦 Actionable Alerts: Min/Max calculations provide early warnings (e.g., declining order volume) or celebrate top-performing months.
- 📊 Profitability Drivers: Combined with dashboards, these calculations highlight whether sales increases are translating into healthier profits.
By combining flexible filters, growth metrics, visual KPIs, and statistical extremes, these Tableau calculations form the backbone of sales and customer performance intelligence. Together, they transform the dashboard into a powerful decision-support tool for business leaders aiming to grow revenue, retain customers, and improve margin efficiency year over year.
2. Sales Dashboard Analysis (2023): Performance, Trends & Strategic Takeaways
📊 1. Overall Performance Snapshot
- Total Sales:
$733K— a 20.4% increase compared to 2022, reflecting strong revenue acceleration. - Total Profit:
$93K— an increase of 12.5%, indicating modest improvement in bottom-line efficiency. - Total Quantity Sold:
12K units— up by 26.8%, suggesting a notable rise in volume, possibly driven by demand growth, promotional strategies, or expanded product variety.
Together, these KPIs signal a healthy YoY expansion in both top-line and unit-based metrics, though profit growth trails sales and volume, hinting at potential margin compression.
📈 2. Trend Analysis: Seasonality & Peaks
- Monthly line charts provide a comparative view of 2023 vs. 2022, with
blackrepresenting current year andgrayfor prior year. - January marked the lowest sales month (orange marker), while December showed a strong finish (blue marker), reinforcing year-end performance spikes, potentially driven by campaigns or seasonal buying behavior.
- This pattern underscores the importance of calendar-based marketing strategies and resource alignment during peak months.
🔍 3. Subcategory Insights: Drivers vs. Drags
- Top Revenue Contributors:
Phones,Chairs, andBindersemerged as leading sales performers, indicating product-market fit and possibly high customer demand. - Highest Profit Contributor:
Copiersstood out by delivering not only high sales but exceptional margins, a potential focal point for targeted growth. - Loss-Making Categories:
AccessoriesandMachinesposted net losses. This warrants investigation into pricing, return rates, or inefficient sourcing/logistics operations.
Understanding which categories dilute vs. drive profit can guide product portfolio optimization and merchandising decisions.
📅 4. Weekly Profitability Trends: Revenue vs. Margin
- 2023 weekly data shows multiple weeks in Q3–Q4 where sales exceeded the $14K average, affirming a solid close to the year.
- However, profit hovered near or below the
$2Kweekly average in several instances, indicating pricing pressure, rising costs, or discount-driven growth. - This divergence suggests that while revenue momentum is strong, margin protection strategies (e.g., cost control, optimized pricing) are essential for sustainable profitability.
By integrating time-based granularity with category-level insights, this sales dashboard empowers stakeholders to not only track performance but also pinpoint operational and strategic improvement areas. Whether managing inventory, adjusting promotions, or refining category investments, these insights form the analytical bedrock of sales-driven decisions.
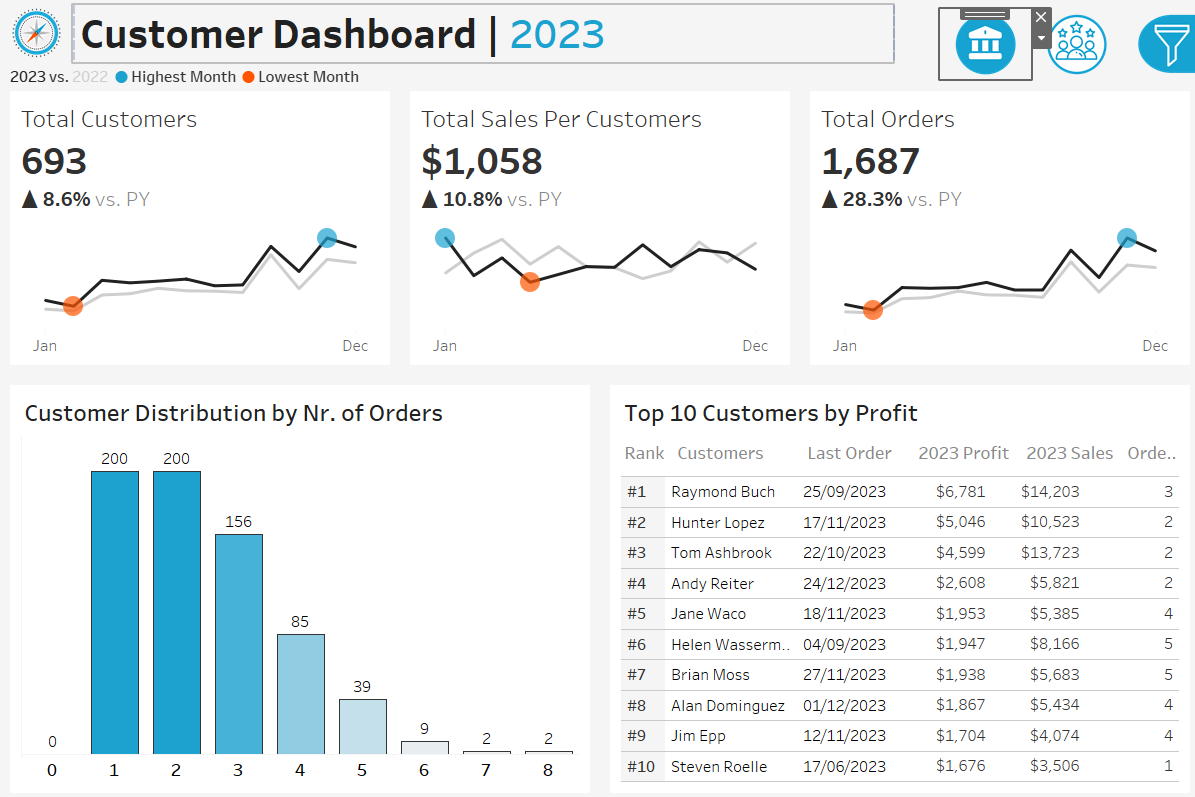
3. Customer Dashboard Analysis (2023): Engagement, Loyalty & Profitability Trends
📊 1. Overall Customer Metrics
- Total Customers:
693, reflecting an 8.6% YoY increase from the previous year. - Total Orders:
1,687, a significant 28.3% rise, far exceeding customer growth rate. - Sales per Customer:
$1,058, up 10.8%, indicating deeper spend per customer or improved upselling effectiveness.
The disproportionate increase in orders relative to customer count suggests improved repeat purchase behavior, increased customer stickiness, and possible success in nurturing buyer relationships beyond first purchase.
📈 2. Customer Behavior Distribution
- The distribution shows a steep drop-off after 1–2 orders:
200 customerseach placed only 1 or 2 orders, followed by a sharp decline for customers with 3+ orders. - This long-tail pattern implies that while acquisition is healthy, customer retention and repeat engagement remain areas for improvement.
- Strategic Opportunity: Introduce loyalty programs, personalized offers, or reorder incentives aimed at converting single-order customers into multi-order buyers, enhancing overall customer lifetime value (CLTV).
🏆 3. Top 10 Customers by Profit
- High-Profit Clients:
Raymond Buch,Hunter Lopez, andTom Ashbrooklead the top 10 list, generating profits between$4.5K – $6.7Kand sales exceeding$10K. - Despite relatively modest order counts (2–4 orders), their large transaction sizes or premium product purchases make them critical revenue drivers.
- Actionable Insight: These profiles can be studied to model high-value customer archetypes and inform targeted acquisition campaigns or VIP programs.
📅 4. Monthly Trends & Seasonality
- Temporal charts mirror the sales dashboard, with January marking the weakest month (orange marker) and December among the strongest (blue marker).
- This affirms a clear seasonal rhythm to customer activity, suggesting end-of-year campaigns or holiday promotions are effectively driving engagement.
- Business Implication: Invest in Q1 onboarding flows and mid-year reactivation efforts to smooth seasonal troughs and maintain steady growth momentum year-round.
This customer dashboard not only quantifies engagement but also illuminates patterns in loyalty, profitability, and seasonal behavior. By combining volume metrics with behavioral distribution and individual profitability rankings, the analysis supports both tactical improvements (e.g., retention initiatives) and strategic planning (e.g., customer tier segmentation, timing of marketing pushes).
4. Cross-Dashboard Insights & Strategic Takeaways
🧠 Key Insights Across Dashboards
-
📈 Growth Across the Board: All major KPIs—including
Total Sales,Total Orders,Quantity Sold, andCustomer Count—show strong YoY increases. This broad growth trajectory reflects positive market traction and potentially effective marketing or distribution strategies. -
⚠️ Margin Pressures Exist: Despite rising sales and order volumes,
Profitgrowth lags behind. Categories likeMachinesandAccessorieseven report net losses, flagging the need for a strategic review of pricing, discounting, or operational efficiency. - 🎯 Top Customers Drive Disproportionate Profit: A small cluster of high-value customers contributes outsized profits. This concentration underscores the value of account-based marketing, VIP loyalty tiers, or concierge services to retain and grow this segment.
-
🔍 Underperforming Categories Need Optimization: Negative-margin product lines suggest possible inefficiencies—from
returnsandcost of goodstodiscount strategies. A deep-dive audit into SKU-level profitability is warranted. - 📉 Sales vs. Profit Disparity by Week: Weekly trendlines reveal sales peaks not matched by profit spikes. This misalignment may be symptomatic of margin-eroding promotions or mispriced campaigns, warranting a review of marketing ROI and campaign performance.
-
💡 Customer Retention Opportunity: The behavioral distribution shows that the majority of customers make only 1–2 purchases. With proper nurturing strategies—such as
email triggers,personalized recommendations, andpost-purchase journeys—this segment can be converted to repeat buyers, increasingSales per Customerand long-term value.
🛠️ Tools & Skills Used
- Tool: Tableau for interactive dashboards and advanced data visualizations
- Data Prep: Calculated fields and logical expressions for year-on-year comparisons, KPI thresholds, and behavioral insights
- Skills Applied:
- 📚 Data storytelling
- 📐 KPI design & benchmarking
- 📊 Trend analysis (monthly/weekly granularity)
- 🔎 Customer segmentation & profiling
- 🧮 Custom metrics & YoY calculations
📌 Portfolio Takeaway
These dashboards illustrate my ability to move beyond surface-level reporting and into analytical depth, combining data-driven metrics with strategic interpretation. Through interactive Tableau dashboards, I translate raw data into clear business narratives—illuminating performance gaps, growth levers, and optimization opportunities for decision-makers.
Whether assessing profitability, customer behavior, or operational health, my approach blends technical fluency with business relevance, creating dashboards that not only inform but inspire action.