
📊 Excel Sales Dashboard – Advanced DAX-Powered Analysis

📘 Project Overview
This project presents an interactive, Excel-based sales dashboard built using Power Pivot and DAX measures. It focuses on analyzing sales performance, product effectiveness, customer value, and temporal trends from a retail dataset. By combining robust data modeling with insightful KPIs, the dashboard helps stakeholders make data-driven business decisions.
🔥 GitHub Repository1. Excel Dashboard – Business Objectives & DAX-Driven Metrics
🎯 Business Objective
This project was built to uncover actionable insights from company-wide retail sales data using calculated DAX measures and interactive Excel dashboards. By analyzing transaction-level information, product performance, profitability, and customer demographics, the dashboard aims to address critical business questions:
- 🔢 How many transactions have been completed? — Measuring operational scale and sales frequency.
- 📦 What percentage of products are actively driving revenue? — Identifying top-selling vs. stagnant inventory.
- 💰 What is the overall profit margin? — Assessing financial efficiency and sustainability.
- 👥 What is the average age of our customers? — Understanding customer demographics for marketing alignment.
- 🚫 How can unsold inventory be minimized? — Highlighting SKUs that require pricing, bundling, or delisting strategies.
The dashboard empowers stakeholders to take strategic action based on historical trends, profit distribution, and customer behavior. It provides both a high-level summary and deep dives into operational metrics.
🧮 Core Measures (DAX)
| Measure | Description |
|---|---|
| #Transaction | Total number of transactions, computed using COUNTROWS(FactInternetSales). |
| All Products | Total number of unique products listed: COUNTROWS(DimProduct). |
| Sold Products | Distinct number of products that were sold: DISTINCTCOUNT(FactInternetSales[ProductKey]). |
| Unsold Products | Inventory items that recorded no sales, calculated as [All Products] - [Sold Products]. |
| % Profit Margin | Proportion of revenue retained as profit: DIVIDE([Total Profit], [Total Revenue], 0). |
| Average Customer Age | Mean age of customers: AVERAGE(DimCustomer[Customer Age]). |
📌 Interpretive Insights
- ✅ Sales Depth: Tracking transactions with
#Transactionreveals how frequently customers purchase, an indicator of business volume and engagement. - 📉 Inventory Health: Comparing
All Productsvs.Sold Productshighlights inefficiencies. A large volume ofUnsold Productssuggests a need for stock realignment. - 💹 Margin Monitoring: The
% Profit Marginmeasure identifies whether sales are being converted into sustainable profits, critical for pricing and COGS evaluation. - 🧠 Customer Targeting:
Average Customer Ageinforms product development, advertising language, and platform selection based on the dominant age group.
These DAX-driven metrics underpin a visually rich Excel dashboard that translates raw data into strategic business intelligence. With clear financial signals and demographic insights, this project exemplifies the power of analytical storytelling in Excel.
2. 📌 Insightful Analysis – Key Business Findings from the Excel Dashboard
1. 🧾 Transactional Overview
Total Transactions: ~60,398
This high transaction count, derived from the #Transaction measure, signals strong sales throughput and suggests healthy customer acquisition and retention.
🔍 This metric serves as a fundamental indicator of business scale and operational volume.
2. 📦 Product Performance
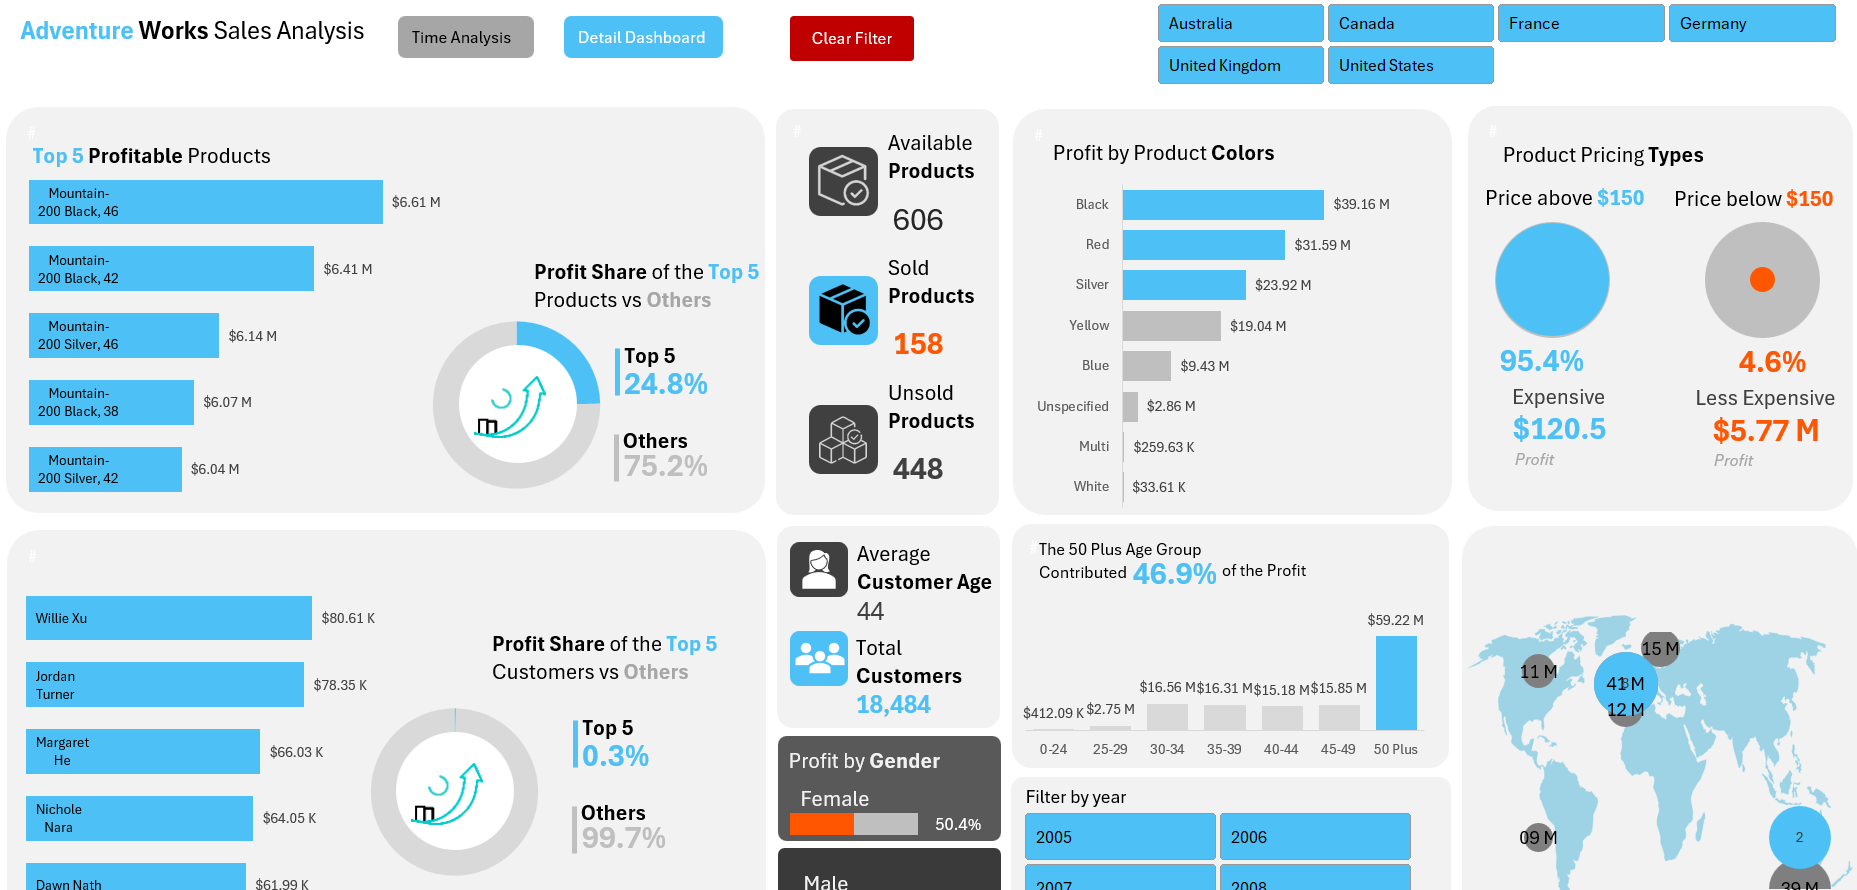
All Products: 606 |
Sold Products: 158 |
Unsold Products: 448 |
Unsold Rate: ~73.9%
With nearly three-quarters of products unsold, the inventory management strategy may require a review. This could involve:
- 📌 Phasing out non-performing SKUs
- 📦 Bundling unsold items with high-demand products
- 📈 Refining merchandising or promotional strategies
📉 This insight encourages product lifecycle evaluation and more efficient stock control.
3. 💰 Profitability Metrics
Total Revenue: ~$307M |
Total Profit: ~$126M |
Profit Margin: ~41.12%
A profit margin above 40% indicates strong cost control and high-margin offerings. This financial health is a key selling point to stakeholders and can support:
- 💸 Reinvestment in marketing or product development
- 📣 Investor confidence and strategic planning
- 🧩 Optimization of pricing strategies
✅ Stable profitability is a cornerstone of sustainable growth.
4. 👥 Customer Demographics
Average Customer Age: Derived from [Average Customer Age]
Though the specific average isn't shown here, the dashboard leverages this DAX measure to better understand customer segments.
🎯 Knowing your average customer age informs:
- 📲 Tailored ad targeting (e.g., Gen Z on TikTok, Boomers on Facebook)
- 🎁 Age-specific product offerings
- 🛍️ Improved customer journey design
5. 📈 Sales Trends and Seasonality
Peak Months: January and May
Profit Distribution: 72% of profits occur on weekdays
Best Quarters: Q1 and Q2
These temporal insights highlight opportunities to:
- 📅 Launch major campaigns in Q1 to maximize ROI
- 👨💼 Align staffing with peak weekday demands
- 📦 Plan inventory purchases ahead of peak months
📊 The dashboard’s time-series analysis supports better forecasting, marketing planning, and logistics.
6. 🎯 Customer Value and Geography
Top Customer: Willie Xu
Top Regions by Profit: Australia, Canada, France
Customer segmentation by value and location enables strategic resource allocation. Key actions include:
- 🌍 Expanding marketing efforts in high-performing regions
- 🛠️ Designing loyalty programs around top customers
- 📌 Prioritizing logistics and stock availability in top markets
Using color-coded dashboards, high-value customers and profitable regions are visually prioritized, enabling quick decision-making and stakeholder alignment.
3. ⚙️ Tools & Techniques + 💡 Business Impact
⚙️ Tools & Techniques
The project leverages a blend of Microsoft Excel’s advanced capabilities and data modeling principles to create a highly interactive and insightful dashboard.
| Tool | Application |
|---|---|
| Microsoft Excel | Used as the core environment for data modeling, interactive slicers, and dashboard development. |
| Power Pivot | Enables the creation of tabular models and the establishment of relationships between tables for efficient data querying. |
| DAX Measures | Deployed to compute advanced KPIs like transaction count, profit margin, and unsold inventory for deeper business insights. |
| Pivot Tables & Charts | Provide dynamic data aggregation and visualizations, empowering users to explore trends and patterns interactively. |
| Conditional Formatting | Highlights high-performing products and customer segments using color-coded visual cues for intuitive analysis. |
💡 Business Impact
The dashboard transforms raw transactional data into actionable business intelligence. Its impact spans multiple strategic areas:
- 📈 Product Profitability: Identifies high-margin products to help prioritize inventory investment and marketing spend.
- 🎯 Customer Targeting: Helps spotlight top-value customers, enabling personalized engagement strategies.
- 📅 Seasonal Strategy: Uncovers sales seasonality, guiding optimal timing for campaigns and stock planning.
- 📦 Inventory Optimization: Reduces unsold inventory by enabling SKU-level performance monitoring.
- 🧬 Customer Insights: Informs demographic segmentation for tailored product development and messaging.
✅ Overall, the dashboard empowers data-driven decision-making across sales, marketing, operations, and customer experience.