
📊 Sales Performance Dashboard (Excel VBA + Pivot Analytics)

🔍 Project Overview
🔥 GitHub Repository1. Excel-Based Sales Dashboard with DAX-Like Power Pivot Measures
📘 Project Overview
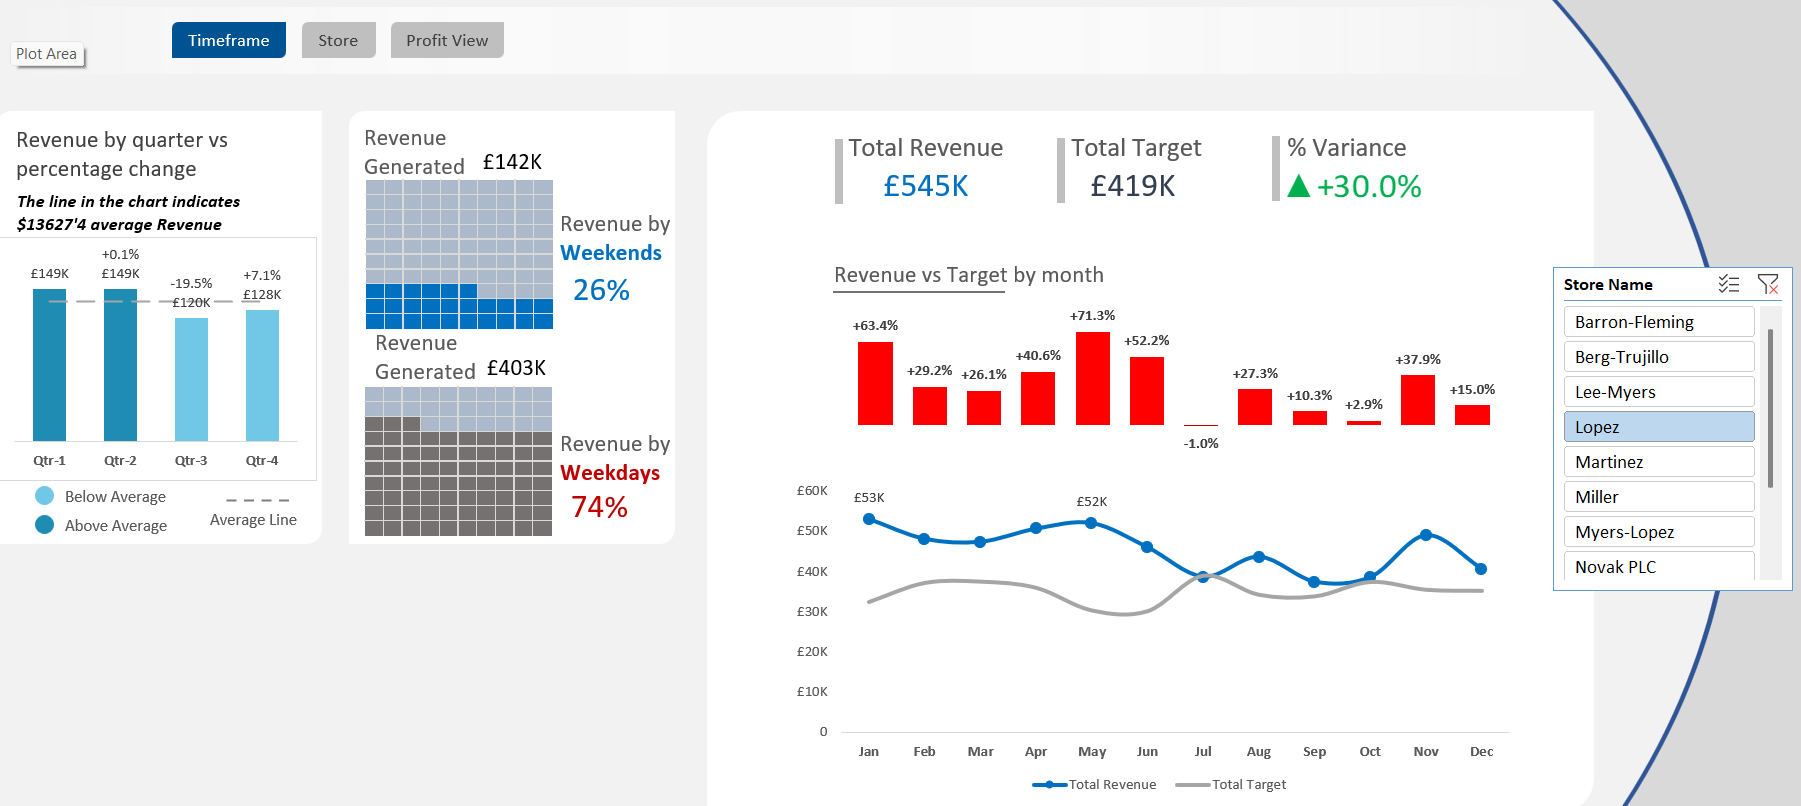
This project showcases a comprehensive Excel-based Sales Dashboard built using advanced features such as pivot tables, slicers, dynamic charts, and VBA macros. The dashboard provides automated, interactive sales analytics to support business decision-making across regions, product categories, customers, and time periods.
🛠 Tools & Technologies
- Microsoft Excel (.xlsm)
- Power Pivot & DAX measures
- VBA (Macros) for automation
- Pivot Tables & Charts
- Slicers and Combo Boxes
- Conditional Formatting
# Total Revenue
Total Revenue =
SUMX(fact_table, RELATED(products_table[Sales Price]) * fact_table[Quantity Sold])

# COGS
COGS =
SUMX(fact_table, RELATED(products_table[Cost Price]) * fact_table[Quantity Sold])

# Profit Margin
Profit Margin =
[Total Revenue] - [COGS]

# % Profit Margin
% Profit Margin =
DIVIDE([Profit Margin], [Total Revenue])

# Total Transactions
Transactions =
COUNTROWS(fact_table)

# Total Refund
Total Refund =
SUMX(fact_table, fact_table[Quantity Returned] * RELATED(products_table[Sales Price]))

# Refund Rate
Refund Rate =
DIVIDE([Total Refund], [Total Revenue], 0)

# Distinct Products Sold
# Products =
DISTINCTCOUNT(fact_table[Product ID])

# Total Quantity Sold
Total Quantity =
SUM(fact_table[Quantity Sold])

# Quantity Returned
Qty Returned =
SUM(fact_table[Quantity Returned])

# Return Rate
Return Rate =
DIVIDE([Qty Returned], SUM(fact_table[Quantity Sold]), 0)

# Total Sales Target
Total Target =
SUM(monthly_store_targets[Monthly Target])

# Distinct Customers
# Customers =
DISTINCTCOUNT(fact_table[Customer ID])

# Distinct Locations
# Locations =
DISTINCTCOUNT(Dim_Customer[Location])

# Average Customer Age
Average Customer Age =
AVERAGE(Dim_Customer[Customer Age])
| Measure | Description |
|---|---|
| Total Revenue | Revenue generated from all products sold. |
| COGS | Total cost incurred for the products sold. |
| Profit Margin | Net profit before taxes, calculated as Revenue minus COGS. |
| % Profit Margin | Profitability expressed as a percentage of total revenue. |
| Transactions | Number of distinct sales transactions. |
| Total Refund | Total value of returned products based on sales price. |
| Refund Rate | Percentage of revenue refunded to customers. |
| # Products | Total number of unique products sold. |
| Total Quantity | Sum of units sold across all products. |
| Qty Returned | Total units returned by customers. |
| Return Rate | Returned units as a percentage of total units sold. |
| Total Target | Sum of all monthly store sales targets. |
| # Customers | Number of distinct customers who made purchases. |
| # Locations | Number of unique customer locations recorded. |
| Average Customer Age | Mean age of customers, useful for demographic insights. |
📊 Data Insights & Interpretation
-
✅ Financial Tracking: Measures like
Total Revenue,COGS, andProfit Marginprovide a high-level overview of business performance. -
🎯 Return Analysis: Metrics such as
Refund RateandReturn Rateidentify product or customer service issues. -
📌 Sales Goals:
Total Targetsupports performance benchmarking across periods and stores. -
🌍 Customer Demographics:
# LocationsandAverage Customer Ageenable targeted marketing and segmentation. - 🔁 Automation: The use of VBA macros improves user experience through automated filtering, resetting, and report generation.
This Excel project highlights strong proficiency in data modeling, DAX-style calculations in Power Pivot, and interactive dashboarding—delivering actionable insights directly within Excel’s familiar interface.
2. Time-Based Sales Performance Analysis
📘 Project Overview
This part of the Excel-based dashboard focuses on time-series analysis, enabling dynamic exploration of sales data across different time periods (monthly, quarterly, and yearly). It empowers stakeholders to track business performance trends, seasonal patterns, and year-over-year growth.
🛠 Tools & Techniques
- Pivot Tables with Time Grouping (Months, Quarters, Years)
- Dynamic Slicers for Date Selection
- Line Charts and Column Charts for Trend Visualization
- Helper Columns in the data model for month/year formatting
- VBA for auto-refreshing views on time filter changes
# Monthly Sales
Monthly Sales =
  CALCULATE(
      [Total Revenue],
      GROUPBY(fact_table, fact_table[Month], fact_table[Year])
  )

# Year-to-Date Revenue
YTD Revenue =
  TOTALYTD([Total Revenue], fact_table[Date])

# Monthly Growth Rate
Monthly Growth =
  DIVIDE(
      [Monthly Sales] - CALCULATE([Monthly Sales], PREVIOUSMONTH(fact_table[Date])),
      CALCULATE([Monthly Sales], PREVIOUSMONTH(fact_table[Date]))
  )

# Year-over-Year Growth
YOY Growth =
  DIVIDE(
      [Monthly Sales] - CALCULATE([Monthly Sales], SAMEPERIODLASTYEAR(fact_table[Date])),
      CALCULATE([Monthly Sales], SAMEPERIODLASTYEAR(fact_table[Date]))
  )
| Metric | Description |
|---|---|
| Monthly Sales | Total revenue grouped by calendar month and year. |
| YTD Revenue | Aggregated revenue from the start of the year to the selected date. |
| Monthly Growth | Growth rate compared to the previous month, useful for trend spotting. |
| YOY Growth | Compares current month revenue to the same month in the previous year. |
📊 Data Insights & Interpretation
- 📅 Seasonality Detection: Identifies recurring high or low sales months for better demand planning.
- 📈 Performance Tracking: Year-to-date and month-over-month growth indicators offer insight into ongoing performance.
- 🎯 Strategic Forecasting: Helps in setting realistic goals and understanding growth trends over time.
- 🔄 Automated Refresh: With VBA integration, the time-based visuals update automatically when new date filters are applied.
This time-series module of the dashboard demonstrates how Excel can be leveraged for powerful trend and growth analysis, typically expected from more advanced BI tools like Power BI—bridging simplicity with insight.
3. Customer and Product Profitability Analytics
📘 Project Overview
This section of the Excel Dashboard focuses on identifying high-value customers and top-performing products by analyzing profitability metrics at both customer and item levels. Interactive combo boxes and slicers enhance user-driven exploration across regions, product categories, and customer segments.
🛠 Tools & Techniques
- Pivot Tables with Customer & Product Hierarchies
- Calculated Fields for Profit Margin and Quantity Sold
- Combo Boxes (Form Controls) for region-based filtering
- Interactive Charts showing Top 5 Customers and Products
- Conditional Formatting to highlight high/low performers
# Total Revenue
Total Revenue =
  SUMX(fact_table, RELATED(products_table[Sales Price]) * fact_table[Quantity Sold])

# Cost of Goods Sold
COGS =
  SUMX(fact_table, RELATED(products_table[Cost Price]) * fact_table[Quantity Sold])

# Profit Margin
Profit Margin = [Total Revenue] - [COGS]

# % Profit Margin
% Profit Margin =
  DIVIDE([Profit Margin], [Total Revenue])

# # Customers
#customers =
  DISTINCTCOUNT(fact_table[Customer ID])

# Top 5 Customers
Top Customers =
  TOPN(5, VALUES(Dim_Customer[Customer Name]), [Profit Margin], DESC)

# # Products
#products =
  DISTINCTCOUNT(fact_table[Product ID])
| Metric | Description |
|---|---|
| Top 5 Customers | Ranked by total profit margin across all their transactions. |
| Most Profitable Product Categories | Categories with the highest net profit, derived from sales minus COGS. |
| Item-Level Profitability | Tracks profit margin at individual product level using calculated fields. |
| Drill-Down by Region | Combo boxes enable regional filtering to explore localized sales performance. |
| Drill-Down by Customer | Interactive analysis by customer name for performance segmentation. |
📊 Data Insights & Interpretation
- 👥 Customer Value Analysis: Focused view of top 5 profit-contributing customers to prioritize relationship management.
- 📦 Product Line Optimization: Reveals high-margin product categories and items, guiding stock and pricing strategies.
- 📍 Regional Trends: Combo box filters empower localized decision-making by isolating top contributors by region.
- 🎯 Precision Targeting: By linking profitability to customer and product segments, the dashboard supports data-driven marketing and resource allocation.
This customer and product module illustrates how Excel can be transformed into a powerful business intelligence tool, leveraging interactive forms, data modeling, and profitability measures to deliver executive-ready insights.
4. Demographic & Behavioral Analytics (Gender & Waffle Charts)
📘 Project Overview
This section of the dashboard provides demographic insights based on customer gender and shopping behavior trends across different days of the week. By analyzing how male and female customers contribute to total sales and how purchases differ on weekends versus weekdays, this module supports data-driven marketing personalization.
🛠 Tools & Techniques
- Pivot Tables grouped by
Customer GenderandDay of Week - Waffle Chart (using conditional formatting + grid layout)
- Gender Pie Chart
- Interactive Slicers for time-based filtering
- Dynamic aggregation using Excel formulas and tables
# Total Revenue (reused)
Total Revenue =
  SUMX(fact_table, RELATED(products_table[Sales Price]) * fact_table[Quantity Sold])

# Total Qty Sold by Gender
Qty by Gender =
  CALCULATE(SUM(fact_table[Quantity Sold]), Dim_Customer[Gender] = "Male/Female")

# Weekend vs Weekday Classification (calculated column in fact_table)
Day Type =
  IF(WEEKDAY(fact_table[Date], 2) > 5, "Weekend", "Weekday")

# Qty by Day Type
Qty by weekday =
  CALCULATE(SUM(fact_table[Quantity Sold]), fact_table[Day Type] = "Weekend")

Qty by weekend =
CALCULATE(SUM(fact_table[Quantity Sold]), fact_table[Day Type] = "Weekday")
| Insight | Description |
|---|---|
| Gender-Based Sales | Shows the share of total quantity sold by male vs female customers using pie chart visuals. |
| Weekend vs Weekday Shopping | Waffle chart visualizes customer behavior based on the day of the week to identify peak shopping periods. |
| Dynamic Day Type Classification | Each transaction is classified as 'Weekend' or 'Weekday' using Excel date functions. |
| Marketing Insight | Useful for targeting promotions—e.g., fashion items on weekends or essentials on weekdays. |
📊 Data Insights & Interpretation
- 🧑🤝🧑 Gender Intelligence: Gender chart helps businesses understand which demographic contributes more to sales, enabling tailored communication.
- 📅 Behavioral Timing: Waffle chart highlights whether customers are more active during weekdays or weekends.
- 📈 Sales Strategy Design: For example, weekday-focused products could be bundled with work essentials, while weekend categories might favor leisure items.
- 🎯 Hyper-Targeting Campaigns: Combine gender and timing filters to personalize campaigns—for instance, women’s fashion promos on Saturday mornings.
This demographic module turns static customer data into actionable marketing intelligence by combining behavioral segmentation and interactive Excel dashboards. It underscores the power of Excel in supporting modern data storytelling.
5. ⚙️ VBA Automation for Dynamic Dashboard Interaction
📘 Project Overview
This segment highlights the use of VBA (Visual Basic for Applications) to automate repetitive tasks within the Excel dashboard. By embedding macros and integrating interactive form controls, the dashboard offers an enhanced user experience that is both efficient and dynamic. These automations eliminate manual filtering and enable real-time view customization.
🛠 Tools & Techniques
- VBA Macros for automated data refresh and UI control
- Combo Boxes and Form Controls for filter selection
- Macro-enabled Excel workbook (.xlsm)
- Event-driven procedures triggered by selection changes
- Protected worksheet views and reset functions
' Sample VBA to Refresh Pivot Table
Sub RefreshAllData()
  ThisWorkbook.RefreshAll
End Sub

' Reset Filters and Slicers
Sub ResetDashboard()
  Dim pt As PivotTable
  For Each pt In Sheets("Dashboard").PivotTables
      pt.ClearAllFilters
  Next pt
  Call RefreshAllData
End Sub

' Dynamic Filter using Combo Box
Private Sub ComboBox1_Change()
  Dim selectedValue As String
  selectedValue = ComboBox1.Value
  Sheets("Dashboard").Range("B2").Value = selectedValue
  Call RefreshAllData
End Sub
| Automation Task | Functionality |
|---|---|
| Data Refresh | Refreshes all data connections and pivot tables with a single macro click. |
| Filter Reset | Clears all filters and slicers across the dashboard instantly. |
| Combo Box Control | Allows users to select regions or customers and dynamically updates visuals accordingly. |
| Event Triggered Views | Macros respond to user selections for a more interactive dashboard experience. |
🚀 Automation Impact & Efficiency
- ⚡ Time-Saving: Frequent manual tasks like filter resets and data refreshes are automated, improving workflow speed.
- 🎯 User-Driven Customization: Combo boxes let users drill down into specific data sets without altering raw data.
- 🔁 Reusability: The VBA scripts can be reused across multiple dashboards for consistent performance enhancements.
- 🔒 Data Integrity: Locked and protected sheets ensure users interact only through guided controls.
Overall, the VBA automation component transforms a static Excel report into a smart, self-updating dashboard capable of interactive exploration and rapid analysis. It demonstrates the potential of Excel beyond formulas—into full-fledged, code-driven analytics solutions.
6. 📈 Impact & Business Value of the Excel Sales Dashboard
💼 Strategic Impact
This Excel-based dashboard is more than just a reporting tool—it's a strategic decision-support system. Designed with automation, interactivity, and user-centric features, it empowers stakeholders across different departments to engage with sales data in meaningful and actionable ways.
🌟 Key Benefits
- 📊 Quick Trend Identification: Visual cues and metrics such as profit margin, refund rate, and sales targets help managers instantly detect positive or negative performance trends and respond proactively.
- 🧠 Self-Service Analytics: With form controls, slicers, and combo boxes, even non-technical users can explore and filter data independently—no advanced Excel or coding knowledge required.
- 🎯 Enhanced Decision-Making: Real-time insights across product categories, customer segments, regions, and time periods support informed, data-driven decisions for marketing campaigns, stock planning, and sales forecasting.
- 🕒 Operational Efficiency: VBA macros automate repetitive tasks like data refreshes and filter resets, saving time and ensuring consistent, up-to-date reporting.
- 🔍 Granular Insights: Drill-down capabilities allow users to explore metrics at customer, product, or regional levels—enabling a deeper understanding of profitability and customer behavior.
🚀 Real-World Application
This dashboard serves as a practical, scalable business intelligence tool ideal for small to mid-sized organizations looking to modernize their reporting without heavy investment in enterprise BI platforms. It showcases how advanced Excel features—when combined with automation and design thinking—can drive operational clarity and business growth.
7. 🧠 What I Learned
💡 Key Skills & Takeaways
- 🎨 User-Centric Dashboard Design: I deepened my understanding of building intuitive and user-friendly Excel dashboards by focusing on interactive design patterns—such as slicers, form controls, and dynamic visualizations that enhance usability for non-technical users.
- 🔧 VBA Programming & Debugging: Through hands-on development, I wrote and refined multiple VBA macros to automate data processes and navigation. This experience improved my confidence in structuring procedures, handling errors, and linking form controls to logic-driven tasks.
- 📊 Layered Visual Storytelling: I learned how to guide users through a narrative by layering visuals in a logical sequence—starting from KPIs and overview charts to granular insights such as customer demographics and product-level profitability.
- ♻️ Template Scalability & Reusability: I designed reusable Excel templates that support consistent formatting and can be updated easily with new data. This approach minimizes rework and improves the sustainability of dashboard projects.
📘 Personal Reflection
This project significantly enhanced my ability to blend data analysis, automation, and design thinking. It showcased how powerful Excel can be when extended with VBA and structured visual storytelling, providing a solid foundation for my future data analyst projects.