
🧠 Project Title: Sales Performance Analysis & Customer Segmentation (SQL & Power BI)

📘 Project Overview
In this project, I conducted an end-to-end data analysis for a retail company’s sales database using SQL Server for data extraction and transformation and Power BI for visualization and advanced metrics via DAX. The goal was to uncover actionable insights into sales trends, customer behavior, product profitability, and regional performance. The final deliverable was an interactive dashboard for stakeholders to drive data-informed decisions.
🔥 GitHub Repository🎯 Business Problem
The company wanted to:
- Understand monthly/yearly sales trends and growth
- Identify top-performing products and salespeople
- Measure customer engagement using RFM (Recency, Frequency, Monetary) segmentation
- Calculate product profitability and profit margins
- Monitor regional sales distribution
- Classify customer churn risk
🔍 Data Exploration & SQL Analysis
Using SQL Server, I extracted and transformed data from a transactional database (Sales, Production, Person, and Customer schemas) with a focus on the SalesOrderHeader, SalesOrderDetail, and related dimension tables.
🧾 SQL Highlights
1. Sales Insights SQL Queries
This section showcases a series of SQL queries designed to extract valuable business insights from a sales dataset. The queries analyze online orders, sales trends, best-selling products, regional performance, customer segmentation, product profitability, and churn analysis.
-- List all base tables in the database
SELECT TABLE_SCHEMA, TABLE_NAME
FROM INFORMATION_SCHEMA.TABLES
WHERE TABLE_TYPE = 'BASE TABLE';

-- View all sales order headers
SELECT *
FROM Sales.SalesOrderHeader;

-- Total Online Orders vs Total Transactions
SELECT COUNT(*) AS OnlineOrders
FROM Sales.SalesOrderHeader
WHERE OnlineOrderFlag = 1;

SELECT COUNT(*) AS TotalTransactions
FROM Sales.SalesOrderHeader;

-- Monthly & Yearly Sales Trend
SELECT
    CAST(OrderDate AS DATE) AS OrderDate,
    YEAR(OrderDate) AS Year,
    MONTH(OrderDate) AS Month,
    SUM(TotalDue) AS TotalSales
FROM Sales.SalesOrderHeader
GROUP BY OrderDate, YEAR(OrderDate), MONTH(OrderDate)
ORDER BY Year, Month;

-- Top 10 Best-Selling Products by Revenue
SELECT TOP 10
    P.Name AS ProductName,
    SUM(SOD.OrderQty) AS TotalQuantitySold,
    SUM(SOD.LineTotal) AS TotalRevenue
FROM Sales.SalesOrderDetail SOD
JOIN Production.Product P ON SOD.ProductID = P.ProductID
GROUP BY P.Name
ORDER BY TotalRevenue DESC;

-- Regional Sales Breakdown
SELECT
    ST.Name AS Region,
    SUM(SOH.TotalDue) AS TotalSales
FROM Sales.SalesOrderHeader SOH
JOIN Sales.SalesTerritory ST ON SOH.TerritoryID = ST.TerritoryID
GROUP BY ST.Name
ORDER BY TotalSales DESC;

-- Customer RFM (Recency, Frequency, Monetary) Summary
WITH RFM AS (
    SELECT
        C.CustomerID,
        MAX(SOH.OrderDate) AS LastPurchaseDate,
        COUNT(SOH.SalesOrderID) AS Frequency,
        SUM(SOH.TotalDue) AS MonetaryValue
    FROM Sales.Customer C
    JOIN Sales.SalesOrderHeader SOH ON C.CustomerID = SOH.CustomerID
    GROUP BY C.CustomerID
)
SELECT
    CustomerID,
    DATEDIFF(DAY, LastPurchaseDate, GETDATE()) AS Recency,
    Frequency,
    MonetaryValue
FROM RFM
ORDER BY MonetaryValue DESC;

-- Year-over-Year (YoY) Sales Growth
WITH SalesYearly AS (
    SELECT
        YEAR(OrderDate) AS SalesYear,
        SUM(TotalDue) AS TotalSales
    FROM Sales.SalesOrderHeader
    GROUP BY YEAR(OrderDate)
)
SELECT
    SalesYear,
    TotalSales,
    LAG(TotalSales) OVER (ORDER BY SalesYear) AS PreviousYearSales,
    ROUND(((TotalSales - LAG(TotalSales) OVER (ORDER BY SalesYear)) /
            LAG(TotalSales) OVER (ORDER BY SalesYear)) * 100, 2) AS YoYGrowth
FROM SalesYearly;

-- RFM Segmentation using NTILE
WITH RFM AS (
    SELECT
        C.CustomerID,
        MAX(SOH.OrderDate) AS LastPurchaseDate,
        COUNT(SOH.SalesOrderID) AS Frequency,
        SUM(SOH.TotalDue) AS MonetaryValue
    FROM Sales.Customer C
    JOIN Sales.SalesOrderHeader SOH ON C.CustomerID = SOH.CustomerID
    GROUP BY C.CustomerID
)
SELECT
    CustomerID,
    DATEDIFF(DAY, LastPurchaseDate, GETDATE()) AS Recency,
    Frequency,
    MonetaryValue,
    NTILE(4) OVER (ORDER BY DATEDIFF(DAY, LastPurchaseDate, GETDATE()) DESC) AS RecencySegment,
    NTILE(4) OVER (ORDER BY Frequency DESC) AS FrequencySegment,
    NTILE(4) OVER (ORDER BY MonetaryValue DESC) AS MonetarySegment
FROM RFM
ORDER BY MonetaryValue DESC;

-- Monthly Moving Average of Sales
WITH MonthlySales AS (
    SELECT
        YEAR(OrderDate) AS Year,
        MONTH(OrderDate) AS Month,
        SUM(TotalDue) AS TotalSales
    FROM Sales.SalesOrderHeader
    GROUP BY YEAR(OrderDate), MONTH(OrderDate)
)
SELECT
    Year,
    Month,
    TotalSales,
    AVG(TotalSales) OVER (ORDER BY Year, Month ROWS BETWEEN 2 PRECEDING AND CURRENT ROW) AS MovingAverage
FROM MonthlySales;

-- Churn Analysis (Active vs Churned Customers)
WITH LastPurchase AS (
    SELECT
        C.CustomerID,
        MAX(SOH.OrderDate) AS LastPurchaseDate
    FROM Sales.Customer C
    JOIN Sales.SalesOrderHeader SOH ON C.CustomerID = SOH.CustomerID
    GROUP BY C.CustomerID
)
SELECT
    CustomerID,
    LastPurchaseDate,
    DATEDIFF(DAY, LastPurchaseDate, GETDATE()) AS DaysSinceLastPurchase,
    CASE
        WHEN DATEDIFF(DAY, LastPurchaseDate, GETDATE()) > 180 THEN 'Churned'
        ELSE 'Active'
    END AS CustomerStatus
FROM LastPurchase
ORDER BY DaysSinceLastPurchase DESC;

-- Salesperson Performance & Ranking
SELECT
    SP.BusinessEntityID AS SalesPersonID,
    P.FirstName + ' ' + P.LastName AS SalesPersonName,
    SUM(SOH.TotalDue) AS TotalSales,
    RANK() OVER (ORDER BY SUM(SOH.TotalDue) DESC) AS SalesRank
FROM Sales.SalesPerson SP
JOIN HumanResources.Employee E ON SP.BusinessEntityID = E.BusinessEntityID
JOIN Person.Person P ON E.BusinessEntityID = P.BusinessEntityID
JOIN Sales.SalesOrderHeader SOH ON SP.BusinessEntityID = SOH.SalesPersonID
GROUP BY SP.BusinessEntityID, P.FirstName, P.LastName
ORDER BY TotalSales DESC;

-- Product Profitability & Margin
SELECT
    P.Name AS ProductName,
    SUM(SOD.OrderQty) AS TotalSold,
    SUM(SOD.LineTotal) AS Revenue,
    SUM(SOD.LineTotal - (SOD.OrderQty * P.StandardCost)) AS Profit,
    ROUND(SUM(SOD.LineTotal - (SOD.OrderQty * P.StandardCost)) / SUM(SOD.LineTotal) * 100, 2) AS ProfitMargin
FROM Sales.SalesOrderDetail SOD
JOIN Production.Product P ON SOD.ProductID = P.ProductID
GROUP BY P.Name
ORDER BY ProfitMargin DESC;

-- Revenue by Product Category
SELECT
    PC.Name AS Category,
    SUM(SOD.LineTotal) AS TotalRevenue
FROM Sales.SalesOrderDetail SOD
JOIN Production.Product P ON SOD.ProductID = P.ProductID
JOIN Production.ProductSubcategory PSC ON P.ProductSubcategoryID = PSC.ProductSubcategoryID
JOIN Production.ProductCategory PC ON PSC.ProductCategoryID = PC.ProductCategoryID
GROUP BY PC.Name
ORDER BY TotalRevenue DESC;
📊 Power BI Dashboard Insights & DAX Metrics
After transforming and modeling the data in Power BI, I built an interactive dashboard with slicers, KPIs, and charts powered by DAX measures.
📈 DAX Measures
2. Sales Insights DAX Queries
This section showcases a series of DAX queries used to derive key sales insights for analyzing trends, growth, and customer segmentation. The queries include moving averages, year-over-year growth, frequency segmentation, and total sales calculations.
-- 1. Moving Average Sales (3-Month Window)
Moving Average =
AVERAGEX(
    DATESINPERIOD('Sales'[Sales Date], MAX('Sales'[Sales Date]), -3, MONTH),
    CALCULATE(SUM('Sales'[Total Sales (£)]))
)

-- 2. Year-over-Year Growth
YoY Growth (%) =
VAR PreviousYearSales = CALCULATE(
    SUM('Sales'[Total Sales (£)]),
    SAMEPERIODLASTYEAR('Sales'[Sales Date])
)
VAR CurrentYearSales = SUM('Sales'[Total Sales (£)])
RETURN
IF(
    NOT(ISBLANK(PreviousYearSales)),
    DIVIDE(CurrentYearSales - PreviousYearSales, PreviousYearSales, 0) * 100,
    BLANK()
)

-- 3. Customer Frequency Segment
FrequencySegment =
VAR Freq = MAX('RFM Analysis'[Frequency])
RETURN
SWITCH(TRUE(),
    Freq >= 10, "Very Frequent",
    Freq >= 5, "Frequent",
    Freq >= 2, "Occasional",
    "Rare"
)

-- 4. Total Sales
Sales_Total = SUM(Sales[Total Sales (£)])

-- 5. Region with highest sales
RegionWithHighestSales =
VAR MaxSales = MAXX( ALL('Sales_By_Region'), [TotalSales] )
RETURN
    CALCULATE(
        MAX('Sales_By_Region'[Region]),
        'Sales_By_Region'[TotalSales] = MaxSales
    )
1. Financial Dashboard Analysis

🔍 Overview
This financial dashboard provides a comprehensive view of sales performance metrics, focusing on order volume, total sales revenue, and online order activity. It emphasizes product-level performance, enabling stakeholders to understand key revenue drivers and align product demand with business strategy.
📈 Key Metrics Summary
- Total Orders: 31,000 — Reflects strong overall customer engagement and product demand.
- Total Sales: $123 Million — Indicates substantial revenue generation, with a high average order value.
- Online Orders: 28,000 — Represents ~90% of total orders, highlighting a digital-first business model.
📦 Product Performance Analysis
Top 10 Products by Revenue
The horizontal bar chart showcases the top revenue-generating products. The leading product is:
- Mountain-200 Black, 38 – Revenue: $4.4M
- Mountain-200 Black, 42 – Revenue: $4.0M
- Mountain-200 Silver, 38 – Revenue: $3.7M
These high-end mountain bikes dominate the revenue chart, showing strong customer preference for premium models.
🧠 Key Observations
- 📈 Mountain-200 Black, 38 generated the highest revenue ($4.4M) with ~2.7K units sold — combining premium pricing with strong demand.
- 📈 Mountain-200 Silver, 38 brought in $3.7M revenue with ~2.4K units sold — showing similar performance.
- 🔍 Road-150 Red, 56 earned $1.8M from ~700 units sold — suggesting niche market appeal or premium pricing.
💡 Insight
- 🚵♂️ Mountain bikes are the primary revenue drivers with higher unit sales and higher prices.
- 🚴♂️ Road bikes, while still valuable, have lower sales volumes and revenue — indicating room for marketing or product development improvements.
🧭 Strategic Implications
- 📦 Inventory: Ensure consistent stock for high-performing Mountain-200 models to avoid lost sales opportunities.
- 📢 Marketing: Focus digital campaigns on top models. Explore bundling options with accessories for upselling.
- 🛠️ Product Development: Introduce new variants (sizes/colors) of best-selling bikes based on customer preferences.
- 🛒 E-commerce: Invest further in the digital experience (SEO, SEM, UX), as 90% of sales are online.
📅 Future Enhancements
- 📊 Add time-series analysis (monthly/quarterly) to track sales trends and marketing impact.
- 👥 Integrate customer segmentation (region, demographics) for targeted marketing strategies.
- 💰 Introduce profitability metrics to analyze margins and actual product contribution to net profit.
🧾 Conclusion
This dashboard delivers clear, actionable insights into the financial and product-level performance of the business. It tells a compelling story of success driven by a few high-performing premium models, with a strong reliance on e-commerce. It empowers data-driven decisions in product, marketing, and operational strategy.
2. Sales Dashboard Analysis – Power BI
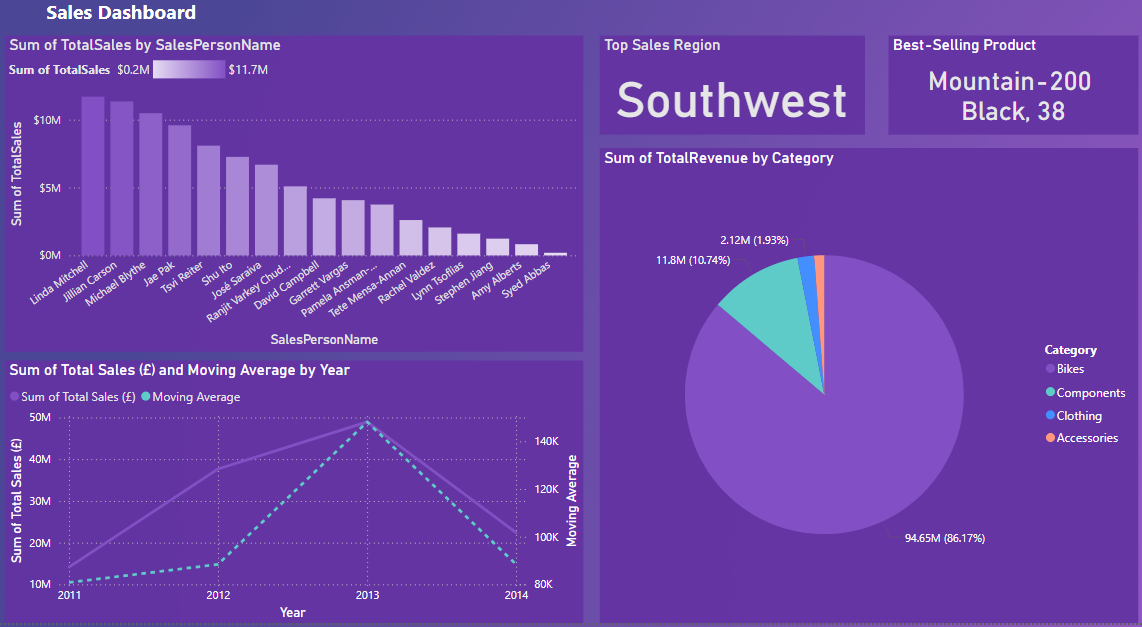
This interactive Power BI dashboard provides a multi-dimensional analysis of sales performance, segmented by sales representatives, regions, product categories, and historical trends. It offers valuable insights into who is driving sales, what’s selling best, and how revenue trends evolve over time.

💼 Key Insights
🧑💼 Sales by Representative
- Linda Mitchell leads with ~$11.7M in sales.
- Jillian Carson and Michael Byrne also exceed $10M in sales each.
- Low performers (e.g., Syed Abbas, Amy Alberts) contributed less than $2M.
Insight: A small group of top reps drives the majority of sales, offering opportunities for peer coaching and team development.
🌍 Regional Sales Performance
- Top Region: Southwest outperforms all other regions.
- Strong regional marketing and presence likely contributing to its success.
Insight: Use Southwest as a benchmark for scaling strategies in underperforming regions.
🚴♂️ Best-Selling Product
- Mountain-200 Black, 38 is the highest-selling SKU—consistent across dashboards.
Insight: Maintain high inventory levels and explore new variants or bundles.
📊 Revenue by Product Category
- Bikes: $94.65M (86.17%)
- Components: $11.8M (10.74%)
- Clothing: $2.12M (1.93%)
- Accessories: Minimal revenue share
Insight: Heavy reliance on bike sales signals a need to diversify through upselling, bundles, and cross-category promotions.
📆 Sales Over Time (2011–2014)
- Peak Year: 2013 (~£50M)
- Decline: Significant drop in 2014 (~£30M)
Insight: Investigate causes of the 2014 downturn—potential areas include pricing, competition, or external market factors.
🎯 Strategic Takeaways
- Rep Performance: Turn top performers into mentors or internal trainers.
- Product Strategy: Build premium or exclusive variants of top-selling SKUs.
- Diversify Revenue: Focus campaigns on accessories and clothing to boost AOV.
- Replicate Regional Success: Adopt Southwest’s tactics in lagging regions.
- Investigate Trends: Deep-dive into causes of revenue drops and mitigate future risks.
✅ Final Thoughts
This Power BI dashboard brings clarity to the relationship between people, products, regions, and time. It supports data-driven planning, pinpoints areas of opportunity, and empowers leadership to act decisively.
Created with Power BI | Interactive Sales Dashboard | Insight-Driven Analytics
3. 🌍 Regional Sales Performance Dashboard – Power BI Analysis
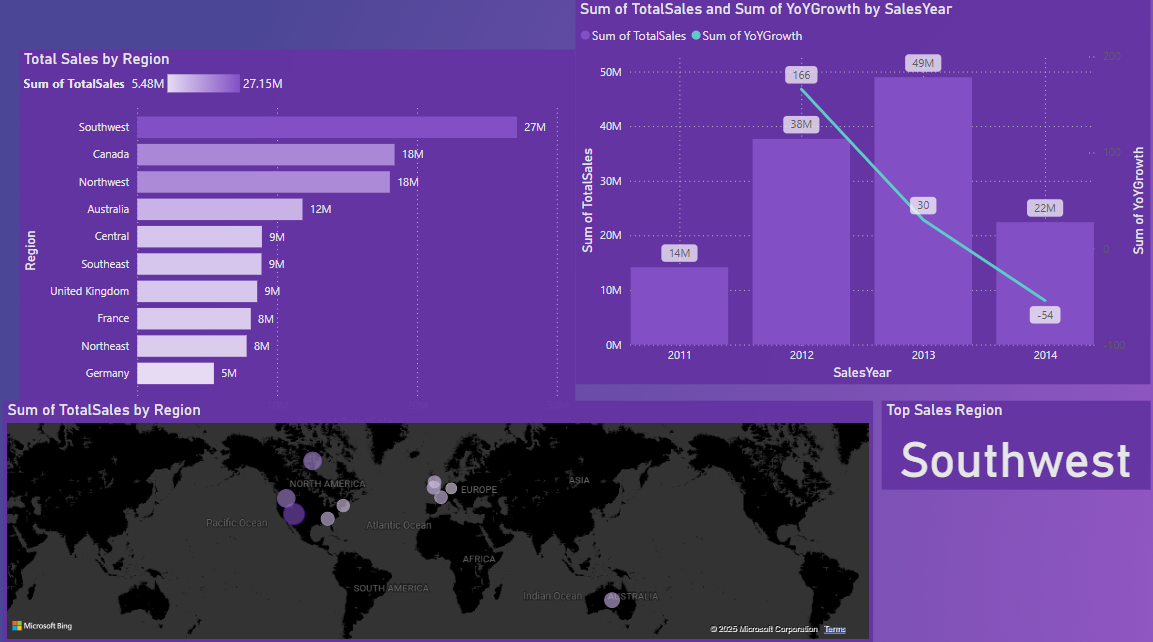
This Power BI dashboard presents a detailed overview of sales distribution by region and year-over-year performance trends, equipping stakeholders with the tools to evaluate market strength and guide data-driven regional investments.

🌎 Regional Sales Distribution
- Top Performer: Southwest leads with ~$27.15M in total sales.
- Followed by Canada and Northwest (both at ~$18M).
- International performance trails, with Germany at ~$5M.
Insight: The Southwest is a critical revenue hub, possibly due to strong local teams or a high product-market fit.
Action: Replicate Southwest’s strategy in weaker regions like Germany and Northeast.
📈 Year-over-Year Sales Trends
- 2011: $14M
- 2012: $38M – YoY Growth: +166%
- 2013: $49M – YoY Growth: +30%
- 2014: $22M – YoY Growth: -54%
Insight: Strong momentum between 2011–2013, followed by a steep decline in 2014.
Business Questions:
- Was the 2014 dip caused by market saturation, pricing, or operational issues?
- Was the decline region-wide or limited to specific markets or products?
Recommendation: Conduct a root-cause analysis and implement predictive models to pre-empt such declines.
🗺️ Geographic Distribution
The sales density map visualizes concentrated sales in North America and Western Europe, with notable outliers in Australia and parts of Asia.
Opportunity: Explore growth in underpenetrated markets like South America, Africa, and emerging Asian economies through targeted feasibility studies.
📌 Regional Sales Snapshot
| Region | Sales (M) |
|---|---|
| Southwest | $27.15 |
| Canada | $18 |
| Northwest | $18 |
| Australia | $12 |
| Central | $9 |
| Southeast | $9 |
| United Kingdom | $9 |
| France | $8 |
| Northeast | $8 |
| Germany | $5 |
Observation: Multiple international markets show comparable sales performance, offering optimization potential through tailored marketing and operational focus.
🧠 Final Thoughts & Strategic Recommendations
- Replicate Success: Use the Southwest region as a blueprint for expansion strategies.
- Analyze Declines: Investigate 2014 performance for corrective action planning.
- Expand Globally: Study market entry points in underserved regions.
- Sustain Growth: Align rapid growth tactics with sustainable scaling frameworks.
Crafted in Power BI | Data-Driven Regional Strategy | Sales Trend Forecasting