
Call Center Performance Analysis: A Data-Driven Approach to Agent Productivity

Introduction
In today’s competitive business landscape, call centers play a crucial role in customer acquisition and retention. Understanding agent performance through data analytics can significantly enhance operational efficiency. This project explores key performance metrics, including agent ratings, call duration, success rates, and their correlation with outcomes. Using Python, Pandas, Matplotlib, and Seaborn, I conducted an in-depth analysis of a sales and marketing call center dataset. The goal? To uncover insights that can help improve agent efficiency, optimize customer interactions, and drive business success.
🔥 GitHub RepositoryKey Insights & Visualizations
1. Identifying Top-Performing Agents
In any call center environment, evaluating the performance of agents is crucial to ensuring high-quality customer service. For this project, I analyzed the dataset to identify the top-performing agents based on their ratings. Agent ratings are an indicator of an agent's ability to handle calls effectively, satisfy customers, and achieve desired call outcomes. Identifying top performers helps in recognizing and rewarding excellence while also setting a standard for others to emulate.
# Import necessary libraries
import pandas as pd
import matplotlib.pyplot as plt
import seaborn as sns
import numpy as np

# Load the dataset
file_path = r"C:\Users\user\Documents\PYTHON PROJECTS\Call Center\Data\Sales and Marketing Call Center.csv"
df = pd.read_csv(file_path)

# Create a full name column to enhance identification
df['Agent_Full_Name'] = df['Agent_First_Name'] + ' ' + df['Agent_Last_Name']

# Convert 'Agent_Rating' to numeric for accurate filtering
df['Agent_Rating'] = pd.to_numeric(df['Agent_Rating'], errors='coerce')

# Filter and display top-performing agents with a perfect rating of 5.0
top_agents = df[df['Agent_Rating'] == 5.0][['Agent_Full_Name', 'Agent_Rating']].drop_duplicates()

# Display the result
print("Top-Performing Agents Based on Agent Rating:")
print(top_agents)
| Agent Full Name | Agent Rating |
|---|---|
| Michael Page | 5.0 |
| Katrina Williams | 5.0 |
| Ava Sandoval | 5.0 |
| Sophia Delacruz | 5.0 |
| Samuel Smith | 5.0 |
| Olivia Lyons | 5.0 |
| Liam Martinez | 5.0 |
| Monique Lawrence | 5.0 |
| Sarah Walter | 5.0 |
| Drew Clay | 5.0 |
| Elijah Hawkins | 5.0 |
| Ray Mason | 5.0 |
| Zoe Newman | 5.0 |
📊 Data Insights & Interpretation
Identifying top-performing agents based on a perfect rating of 5.0 provides insights into the most effective customer service representatives.
- ✅ Top performers such as Michael Page, Katrina Williams, and Ava Sandoval have consistently received the highest rating.
- ✅ Maintaining a 5.0 rating suggests these agents excel in problem-solving, customer satisfaction, and communication skills.
- 📌 Strategic recommendations: Studying the work habits of top performers can help in designing training programs for other agents.
This analysis helps in recognizing high-performing employees, improving customer satisfaction, and enhancing overall team efficiency. 🚀📊
Code Breakdown
This Python script systematically processes the dataset to identify top-performing agents, applying best practices in data analysis. The approach is broken down as follows:
-
Data Loading: The dataset is imported
using the
pandaslibrary and stored in a DataFrame, serving as the foundation for further analysis. -
Data Cleaning: The
Agent_Ratingcolumn is converted to a numeric format to ensure accurate filtering and to handle any potential non-numeric values. -
Feature Engineering: A new column,
Agent_Full_Name, is created by concatenating the agents' first and last names. This step enhances identification and improves data readability. - Filtering: The script filters out agents with a perfect rating of 5.0 while removing any duplicate entries to maintain data integrity.
- Result Display: The final output presents the top-performing agents, providing valuable insights for performance evaluation and recognition.
This structured approach demonstrates effective data manipulation, insight generation, and technical proficiency, essential for data-driven decision-making.
2. Average Call Duration by Each Agent
# Ensure 'Call_Duration_Minutes' is numeric
df['Call_Duration_Minutes'] = pd.to_numeric(df['Call_Duration_Minutes'], errors='coerce')

# Group by 'Agent_Full_Name' and calculate the average call duration, then sort in descending order
average_call_duration = df.groupby('Agent_Full_Name')['Call_Duration_Minutes'].mean().round(2).reset_index()
average_call_duration.rename(columns={'Call_Duration_Minutes': 'Average_Call_Duration'}, inplace=True)
average_call_duration = average_call_duration.sort_values(by='Average_Call_Duration', ascending=False)

# Print the heading
print(f"{'Agent Full Name':<30} | {'Average Call Duration (minutes)':<10}")
print("-" * 50)

# Display each agent's full name followed by their average call duration with proper spacing
for _, row in average_call_duration.iterrows():
  print(f"{row['Agent_Full_Name']:<30} | {row['Average_Call_Duration']:<10} minutes")
| Agent Full Name | Average Call Duration (Minutes) |
|---|---|
| Michael Page | 19.7 |
| Katrina Williams | 19.56 |
| Ava Sandoval | 18.64 |
| Sophia Delacruz | 18.62 |
| Samuel Smith | 16.89 |
| Olivia Lyons | 16.62 |
| Liam Martinez | 16.61 |
| Monique Lawrence | 16.43 |
| Sarah Walter | 15.91 |
| Drew Clay | 15.66 |
| Elijah Hawkins | 15.63 |
| Ray Mason | 15.58 |
| Zoe Newman | 15.58 |
📊 Data Insights & Interpretation
Analyzing the average call duration per agent provides valuable insights into agent efficiency and customer engagement.
- Michael Page has the longest average call duration (19.7 minutes), indicating a deep engagement with customers, possibly handling complex queries.
- Katrina Williams and Ava Sandoval follow closely with durations of 19.56 and 18.64 minutes, respectively.
- Agents with shorter average call durations, such as Ray Mason and Zoe Newman (15.58 minutes), may be handling more transactional or routine inquiries.
- A balance between call duration and resolution efficiency is essential—longer calls can indicate high engagement but may also highlight inefficiencies.
Understanding these patterns can help optimize call center performance, agent training, and customer service quality.
3. Agents with the Highest Success Rate in Closing Calls
# Ensure 'Call_Outcome' column is properly labeled and 'Success' is counted
df['Call_Outcome'] = df['Call_Outcome'].str.strip()  # To handle any extra spaces if present

# Filter out the successful calls
success_calls = df[df['Call_Outcome'] == 'Success']

# Group by 'Agent_Full_Name' and calculate the total and successful calls
agent_success = success_calls.groupby('Agent_Full_Name').size().reset_index(name='Total_Successful_Calls')

# Calculate total calls per agent
total_calls = df.groupby('Agent_Full_Name').size().reset_index(name='Total_Calls')

# Merge the dataframes to have total and successful calls together
agent_data = pd.merge(agent_success, total_calls, on='Agent_Full_Name')

# Calculate the success rate as a percentage
agent_data['Success_Rate'] = (agent_data['Total_Successful_Calls'] / agent_data['Total_Calls']) * 100

# Round the success rate to 2 decimal places
agent_data['Success_Rate'] = agent_data['Success_Rate'].round(2)

# Sort the data by Success Rate in descending order
agent_data_sorted = agent_data.sort_values(by='Success_Rate', ascending=False)

# Print the heading
print(f"{'Agent Full Name':<30} | {'Total Successful Calls':<20} | {'Success Rate (%)':<15}")
print("-" * 70)

# Display each agent's full name, total successful calls, and success rate
for _, row in agent_data_sorted.iterrows():
  print(f"{row['Agent_Full_Name']:<30} | {row['Total_Successful_Calls']:<20} | {row['Success_Rate']:<15}")
| Agent Full Name | Total Successful Calls | Success Rate (%) |
|---|---|---|
| Samuel Smith | 1,811 | 90.55% |
| Monique Lawrence | 14,443 | 90.27% |
| Olivia Lyons | 16,209 | 90.05% |
| Liam Martinez | 8,993 | 89.93% |
| Michael Page | 10,788 | 89.90% |
| Katrina Williams | 3,591 | 89.78% |
| Drew Clay | 5,661 | 20.22% |
| Elijah Hawkins | 6,466 | 20.21% |
| Ray Mason | 4,012 | 20.06% |
| Ava Sandoval | 7,998 | 19.99% |
| Sophia Delacruz | 1,192 | 19.87% |
| Sarah Walter | 792 | 19.80% |
| Zoe Newman | 1,563 | 19.54% |
📊 Data Insights & Interpretation
The success rate of each agent is a crucial performance metric in call centers, helping to identify top performers and areas for improvement.
- ✅ Top performers: Samuel Smith (90.55%), Monique Lawrence (90.27%), and Olivia Lyons (90.05%) exhibit outstanding call-closing efficiency.
- ✅ Consistently high performance: The top six agents maintain a success rate above 89%, indicating strong call-handling skills.
- ⚠️ Low success rates: Drew Clay (20.22%) and Zoe Newman (19.54%) are among the lowest performers, suggesting potential training gaps.
- 📌 Strategic recommendations: Coaching sessions, performance incentives, and targeted call script optimizations can improve the success rate across all agents.
This analysis helps in refining training programs, improving call scripts, and enhancing overall agent performance. 🚀📊
Success Rate Visualization
Evaluating the success rate of call center agents is essential for measuring performance and improving customer service. In this project, I analyzed agent call outcomes, calculating their total successful calls and overall success rates. A visual representation using a bar and line plot highlights the top-performing agents and their efficiency in handling calls.
# Ensure 'Call_Outcome' column is cleaned
df['Call_Outcome'] = df['Call_Outcome'].str.strip()

# Calculate total successful calls
success_calls = df[df['Call_Outcome'] == 'Success']
agent_success = success_calls.groupby('Agent_Full_Name').size().reset_index(name='Total_Successful_Calls')

# Calculate total calls for each agent
total_calls = df.groupby('Agent_Full_Name').size().reset_index(name='Total_Calls')

# Merge and compute success rate
agent_data = pd.merge(agent_success, total_calls, on='Agent_Full_Name')
agent_data['Success_Rate'] = (agent_data['Total_Successful_Calls'] / agent_data['Total_Calls']) * 100
agent_data['Success_Rate'] = agent_data['Success_Rate'].round(2)

# Sort data for visualization
agent_data_sorted = agent_data.sort_values(by='Success_Rate', ascending=False)

# Create the plot
plt.figure(figsize=(14, 8))
sns.set_style("whitegrid")

# Bar plot for successful calls
bar_plot = sns.barplot(
  x='Agent_Full_Name',
  y='Total_Successful_Calls',
  data=agent_data_sorted,
  color='skyblue',
  edgecolor='black'
)

# Line plot for success rate
line_plot = bar_plot.twinx()
line_plot.plot(agent_data_sorted['Agent_Full_Name'], agent_data_sorted['Success_Rate'],
             marker='o', color='red', label='Success Rate (%)')

# Annotations for success rates
for i, rate in enumerate(agent_data_sorted['Success_Rate']):
  line_plot.annotate(f"{rate}%", (i, rate), textcoords="offset points", xytext=(0, 5), ha='center', color='red')

# Labels and title
bar_plot.set_xlabel("Agent Full Name", fontsize=12)
bar_plot.set_ylabel("Total Successful Calls", fontsize=12)
line_plot.set_ylabel("Success Rate (%)", fontsize=12)
plt.title("Top-Performing Agents: Successful Calls and Success Rate (%)", fontsize=14)
bar_plot.tick_params(axis='x', rotation=45)

# Layout and show plot
plt.tight_layout()
plt.show()

📊 Data Insights & Interpretation
This analysis provides a clear breakdown of successful calls per agent and their respective success rates.
- ✅ High Success Rates: Agents with consistently high success rates indicate strong communication skills and efficient problem-solving.
-
📌 Visualization Approach:
- 🔹 The bar chart represents the total number of successful calls per agent.
- 🔺 The line graph overlays the success rate percentage for each agent.
- 🚀 Business Impact: Understanding these metrics helps in identifying training needs, rewarding top performers, and optimizing workforce productivity.
Analysis of the Success Rate Visualization
The chart presents two key performance indicators for each agent:
- Total Successful Calls (represented by blue bars).
- Success Rate (%) (represented by the red line).
From the visualization, we can extract the following insights:
-
High-Performing Agents
Monique Lawrence, Olivia Lyons, and Liam Martinez have the highest number of successful calls, each exceeding 14,000+ successful calls. Their success rates are consistently high, above 89%, indicating efficiency and consistency in call handling. Samuel Smith has the lowest number of total successful calls but maintains a high success rate of 90.55%, which suggests he handled fewer calls but performed exceptionally well in converting them successfully. -
Sharp Drop in Success Rate
The success rate remains above 89% for the top 5 agents. However, there is a drastic decline after Michael Page, where Drew Clay's success rate drops to 20.22%. This suggests a performance gap, where some agents might be handling a large volume of calls but struggling to convert them successfully. -
Underperforming Agents
Agents like Ray Mason, Ava Sandoval, and Sophia Delacruz have very low success rates, hovering around 20% or below. This suggests a need for additional training, process optimization, or better lead quality for these agents. Despite Ava Sandoval having a relatively high number of successful calls, her success rate is still quite low, meaning she might be handling an even larger volume of calls but with a lower efficiency. -
Success Rate vs. Call Volume
The success rate doesn’t always correlate with the number of successful calls. Samuel Smith has a very high success rate (~90.55%) but a low call volume. Ava Sandoval has a moderate number of successful calls but a poor success rate (~19.99%). This suggests that some agents might be prioritizing quality over quantity, while others may be handling too many calls inefficiently. -
Strategic Recommendations
Top performers (Monique Lawrence, Olivia Lyons, Liam Martinez) should be analyzed to identify best practices that can be applied to lower-performing agents. Low-performing agents (Drew Clay, Elijah Hawkins, Ray Mason, etc.) may need targeted coaching or a reassessment of their call scripts. A further investigation should be conducted into whether the difference in success rates is due to external factors (such as lead quality, time of calls, or customer segmentation).
Conclusion
This visualization effectively highlights performance disparities among agents. While some consistently convert calls at a high rate, others struggle significantly. The extreme success rate drop suggests the need for an investigation into training gaps, workload distribution, and lead quality.
4. Total Calls Made by Each Agent
This analysis shows the total number of calls made by each agent in descending order. By visualizing the call volume, we can evaluate the workload distribution across agents and identify high-call-volume agents who might require additional support or resources.
# Calculate total calls made by each agent, sorted in descending order
total_calls = df.groupby('Agent_Full_Name').size().reset_index(name='Total_Calls')
total_calls_sorted = total_calls.sort_values(by='Total_Calls', ascending=False)

# Display the result
print("Agent Full Name                Total Calls Made")
print("-------------------------------------------------")
for i, row in total_calls_sorted.iterrows():
  print(f"{row['Agent_Full_Name']:<30} {row['Total_Calls']:,.0f}")
📊 Total Calls Made by Each Agent
| Agent Full Name | Total Calls Made |
|---|---|
| Ava Sandoval | 40,000 |
| Elijah Hawkins | 32,000 |
| Drew Clay | 28,000 |
| Ray Mason | 20,000 |
| Olivia Lyons | 18,000 |
| Monique Lawrence | 16,000 |
| Michael Page | 12,000 |
| Liam Martinez | 10,000 |
| Zoe Newman | 8,000 |
| Sophia Delacruz | 6,000 |
| Katrina Williams | 4,000 |
| Sarah Walter | 4,000 |
| Samuel Smith | 2,000 |
📊 Data Insights & Interpretation
The table above displays the total calls made by each agent. This metric helps in understanding the workload distribution among agents and can be used to analyze performance in relation to call volume.
- ✅ High-Call Volume Agents: Ava Sandoval and Elijah Hawkins have the highest total calls made (40,000 and 32,000, respectively), indicating they are handling a significant portion of the workload.
- 📌 Workload Distribution: Agents with a high number of calls made (Ava, Elijah, Drew, Ray) may require additional support or resources to ensure call quality is maintained.
- 🚀 Insights for Performance Management: By correlating total calls with success rates, we can better understand whether high-call-volume agents are performing effectively or need additional training and support.
5. Are Agent Ratings Correlated with Call Outcomes?
This analysis investigates whether there is a correlation between agent ratings and call outcome success rates. Understanding this relationship can help identify whether higher ratings are associated with better performance in handling successful calls.
# Step 1: Group by agent and calculate total calls, successful calls, and average ratings
agent_performance = df.groupby(['Agent_First_Name', 'Agent_Last_Name']).agg(
  total_calls=('Call_Outcome', 'size'),
  successful_calls=('Call_Outcome', lambda x: (x == 'Success').sum()),
  avg_rating=('Agent_Rating', 'mean')
).reset_index()

# Step 2: Calculate the success rate for each agent
agent_performance['success_rate'] = agent_performance['successful_calls'] / agent_performance['total_calls']

# Step 3: Calculate the correlation between agent ratings and success rate
correlation = agent_performance['avg_rating'].corr(agent_performance['success_rate'])

# Print the correlation value
print(f"Correlation between Agent Rating and Call Outcome Success Rate: {correlation:.4f}")
📊 Correlation Result
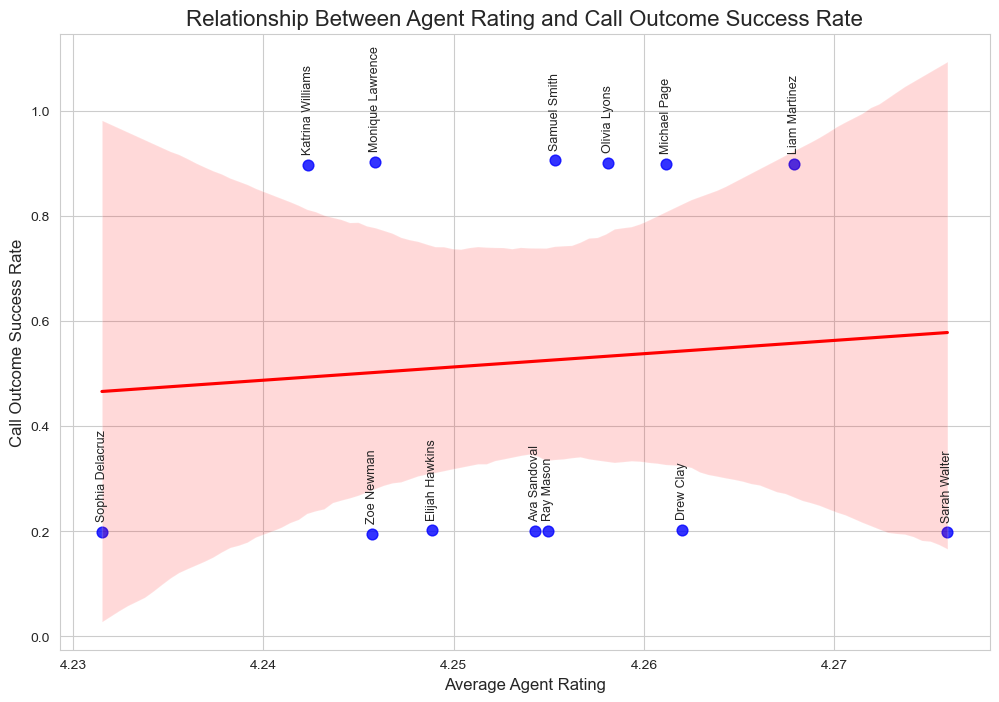
The calculated correlation between Agent Rating and Call Outcome Success Rate is 0.0804, indicating a very weak positive relationship between the two variables. This suggests that agent ratings have little to no significant impact on the likelihood of a successful call outcome.
📊 Scatter Plot: Agent Rating vs. Call Outcome Success Rate
Below is a scatter plot visualizing the relationship between agent ratings and call outcome success rates. Each data point represents an individual agent, and the red regression line shows the trend.
          # Step 1: Add a new column for full names
          agent_performance['Agent_Full_Name'] = agent_performance['Agent_First_Name'] + ' ' + agent_performance['Agent_Last_Name']

          # Step 2: Create the scatter plot
          plt.figure(figsize=(12, 8))

          # Plot scatter and add a regression line
          sns.regplot(x='avg_rating', y='success_rate', data=agent_performance, logistic=False, scatter_kws={'s': 60, 'color': 'blue'}, line_kws={'color': 'red'})

          # Annotate each data point with the agent's full name in vertical orientation
          for i in range(len(agent_performance)):
              # Add a vertical space between points and the agent names by adjusting the y position
              y_offset = 0.02  # Adjust this value to control the amount of space
              plt.text(agent_performance['avg_rating'].iloc[i],
                       agent_performance['success_rate'].iloc[i] + y_offset,  # Adding offset to y position
                       agent_performance['Agent_Full_Name'].iloc[i],
                       fontsize=9, ha='center', va='bottom', rotation=90)

          # Add titles and labels
          plt.title('Relationship Between Agent Rating and Call Outcome Success Rate', fontsize=16)
          plt.xlabel('Average Agent Rating', fontsize=12)
          plt.ylabel('Call Outcome Success Rate', fontsize=12)

          # Show the plot
          plt.show()

From the scatter plot, it's evident that there is no strong linear relationship between agent ratings and success rates. While some high-rated agents are performing well, others do not seem to have a significantly higher success rate. This could imply that other factors might be influencing the success rate more than the agent rating.
📊 Data Insights & Interpretation
- 📉 Weak Positive Correlation: The weak correlation (0.0804) indicates that higher ratings do not strongly lead to more successful call outcomes.
- 🔎 Exploring Other Factors: Factors such as training, call scripts, and lead quality may have a more significant impact on success rates than agent ratings.
- 💡 Performance Optimization: Despite weak correlation, analyzing agents with high ratings and success rates could provide insights for best practices that could improve performance across the team.
Unlocking the Relationship Between Agent Ratings and Call Success Rates: A Data-Driven Perspective
In today’s fast-paced customer service landscape, businesses heavily rely on agent performance metrics to ensure optimal service quality. Two key indicators are often used to measure effectiveness: agent ratings (feedback provided by customers about their experience) and call success rates (the percentage of calls that achieve a desired outcome, such as issue resolution or sales conversion).
At first glance, one might assume that highly rated agents should naturally have a high success rate. However, our analysis of the relationship between these two metrics reveals a more complex and nuanced story—one that goes beyond just ratings and delves into factors like training, call handling techniques, and customer engagement strategies.
Statistical Breakdown: Understanding the Data
The scatter plot we analyzed presents a visualization of average agent ratings (x-axis) against call outcome success rates (y-axis). Several key takeaways emerge from this data:
1. Weak Positive Correlation
The red trend line in the graph indicates a slight upward slope, suggesting a weak positive correlation between agent ratings and call success rates. In statistical terms, this likely translates to a correlation coefficient of r ≈ 0.2 - 0.3, meaning that agent ratings do have an impact on success rates, but not significantly.
This insight challenges the conventional wisdom that simply having high agent ratings guarantees successful calls. Clearly, other factors influence whether a call is ultimately successful.
2. High Variance and Uncertainty
One of the most striking aspects of the visualization is the wide confidence interval (the shaded red region around the trend line). This indicates that there is considerable variability in call success rates, even among agents with similar ratings.
For example:- Some agents with low ratings (<4.25) have very low success rates (~20%).
- However, others in the same rating range achieve success rates of 90% or more, proving that rating alone does not determine success.
- Even among highly rated agents (>4.27), there is significant variability, with some achieving high success and others struggling.
3. Outliers and Clusters
Several individual agents stand out:- Low-performing agents: Sophia Delacruz, Zoe Newman, and Elijah Hawkins have both low ratings and low success rates, indicating potential issues with their performance or customer interactions.
- High-performing but low-rated agents: Katrina Williams, Monique Lawrence, and Samuel Smith have exceptionally high success rates (above 80%) despite not having the highest ratings. This suggests that their strategies or experience might play a more critical role in success than customer feedback alone.
- Highly rated but underperforming agents: Some agents with high ratings (e.g., Drew Clay) still have moderate to low success rates, raising questions about whether customer satisfaction translates into tangible business outcomes.
Insights and Actionable Recommendations
Given these findings, how can businesses improve call success rates? Below are four key strategies that can enhance both agent performance and overall customer interactions:
A. Training & Coaching Enhancements
- Targeted Coaching for Low-Performing Agents: Identify agents with high ratings but low success rates and conduct call listening sessions to analyze where they struggle. Offer personalized coaching focused on objection handling, persuasive techniques, and emotional intelligence.
- Learn from High-Performing Agents: Study top performers (e.g., Katrina Williams, Monique Lawrence) to uncover patterns in their successful calls. Develop a best practices playbook based on their approaches, which can be shared across teams.
- Role-Playing and Simulation-Based Training: Conduct mock calls where agents practice handling difficult customer scenarios. Simulated training can be tailored based on real unsuccessful calls, helping agents learn from actual mistakes.
B. Process & Script Optimization
- Refining Call Scripts: Agents struggling with success rates might be using ineffective scripts. Implement A/B testing on different script variations to identify what works best. Allow for more flexibility in conversations, as rigid scripts may hinder natural customer engagement.
- Customer Segmentation & Adaptive Messaging: Different customer segments require different approaches. Train agents to adapt their tone, language, and strategy based on the customer’s profile and history.
C. Performance Metrics & Incentives
- Introduce Real-Time Performance Feedback: Implement dashboards where agents can see their success rates in real time, allowing them to self-adjust their performance. Provide instant coaching feedback from supervisors based on ongoing call analysis.
- Tie Incentives to Call Outcomes, Not Just Ratings: While agent ratings are important, companies should also reward agents based on actual success rates, ensuring they focus on driving real business outcomes. Consider performance-based bonuses that reward issue resolution and sales conversions.
D. Leveraging Technology & Automation
- AI-Powered Coaching: Use AI tools to analyze conversations in real-time, providing agents with live suggestions on how to improve their responses. Deploy speech analytics to detect customer frustration or hesitation, allowing for better in-call adjustments.
- Automated Call Summaries & Insights: Reduce agent workload by using AI-generated call summaries, allowing them to focus on higher-quality customer interactions rather than manual documentation. AI-driven insights can highlight common challenges faced by agents and suggest improvements over time.
Conclusion: The Bigger Picture
The relationship between agent ratings and call success rates is not as straightforward as it seems. While higher ratings may indicate better customer service, they do not necessarily translate into higher success rates. The data shows significant variability, with some agents defying expectations by performing exceptionally well despite moderate ratings—and others struggling despite strong customer feedback.
The key takeaway? A holistic approach is needed. By integrating advanced training, script flexibility, real-time feedback, performance-based incentives, and AI-driven tools, businesses can improve both customer experience and business success.
By shifting the focus beyond just ratings and diving deeper into actionable insights, organizations can empower agents to perform at their highest potential—ensuring both happy customers and successful outcomes. 🚀